25 Must-Know Trading Strategies That You Can Implement Today (2024)
I think you'll agree with me when I say:
It's REALLY challenging to find reliable trading strategies that consistently deliver results.
Well, while not as easy as it used to be, you can still significantly enhance your trading performance by leveraging must-know trading strategies.
This post will guide you through 25 actionable trading strategies, tailored to help you capitalize on market opportunities using indicators like RSI, MACD, Bollinger Bands, and more.
We will share some of the most popular settings to open and close orders for each indicator.
- Maximize Profits with Relative Strength Index (RSI)
- Capture Trends Early with Accelerator/Decelerator Oscillator (AC)
- Detect Market Strength with Accumulation/Distribution Line (AD)
- Evaluate Trend Strength with Average Directional Movement Index (ADX)
- Follow Market Trends with Alligator Indicator (Alligator)
- Measure Market Momentum with Awesome Oscillator (AO)
- Manage Volatility with Average True Range (ATR)
- Identify Overbought/Oversold Conditions with Bollinger Bands (Bands)
- Gauge Bearish Market Strength with Bears Power (BearsPower)
- Assess Bullish Market Strength with Bulls Power (BullsPower)
- Facilitate Trade with Market Facilitation Index (BWMFI)
- Identify Cyclical Trends with Commodity Channel Index (CCI)
- Evaluate Demand with DeMarker Indicator (DeMarker)
- Identify Overbought/Oversold Conditions with Envelopes (Envelopes)
- Measure Price Movement Strength with Force Index (Force)
- Spot Reversal Points with Fractals (Fractals)
- Follow Trends with Moving Average (MA)
- Identify Momentum Changes with MACD (MACD)
- Analyze Money Flow with Money Flow Index (MFI)
- Measure Trend Strength with Momentum Indicator (Momentum)
- Confirm Trends with On Balance Volume (OBV)
- Seize Opportunities with Parabolic SAR (SAR)
- Assess Market Risk with Standard Deviation (StdDev)
- Identify Reversal Points with Stochastic Oscillator (Stochastic)
- Focus on Price Extremes with Williams Percentage Range (WPR)
- Now it's your turn
1. Maximize Profits with Relative Strength Index (RSI)
Overview: RSI measures the speed and change of price movements to identify overbought or oversold conditions.
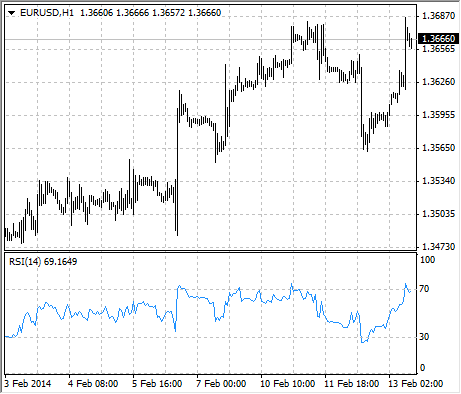
- Settings: RSI period = 14, shift = 1, price = price_close
- Open Order: When RSI is below 30.
- Close Order: When RSI is above 70.
- Benefit: Helps you identify potential reversal points for mean reversion strategies.
2. Capture Trends Early with Accelerator/Decelerator Oscillator (AC)
Overview: This indicator measures the acceleration or deceleration of the market's driving force.
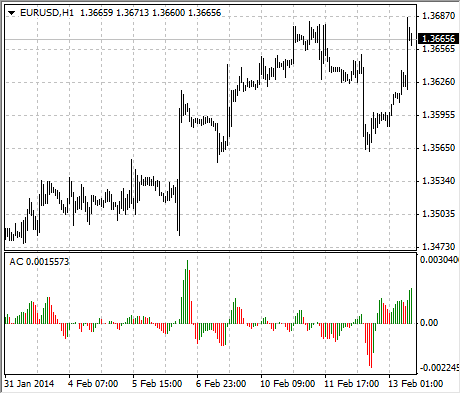
- Settings: Shift = 1
- Open Order: When the AC is greater than 0.
- Close Order: When the AC is smaller than 0.
- Benefit: Allows you to capitalize on emerging trends with a trend-following strategy.
3. Detect Market Strength with Accumulation / Distribution Line (AD)
Overview: Uses volume and price to determine if a stock is being accumulated or distributed.
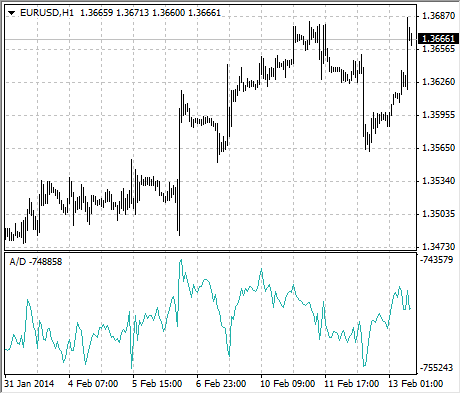
- Settings: Shift = 1/0
- Open Order: When the A/D line starts to rise, indicating accumulation.
- Close Order: When the A/D line starts to fall, indicating distribution.
- Benefit: Helps you gauge market sentiment and volume flow for better trade decisions.
4. Evaluate Trend Strength with Average Directional Movement Index (ADX)
Overview: ADX measures the strength of a trend, regardless of its direction.
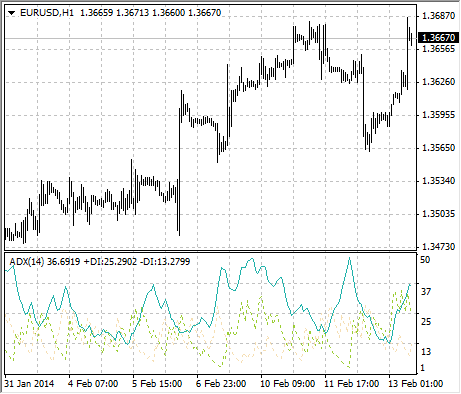
- Settings: ADX period = 14, price = price_close, mode = mode_main, shift = 1
- Benefit: Enhances other trend-following strategies by confirming trend strength.
5. Follow Market Trends with Alligator Indicator (Alligator)
Overview: Uses three smoothed moving averages to indicate market trends and potential reversals.
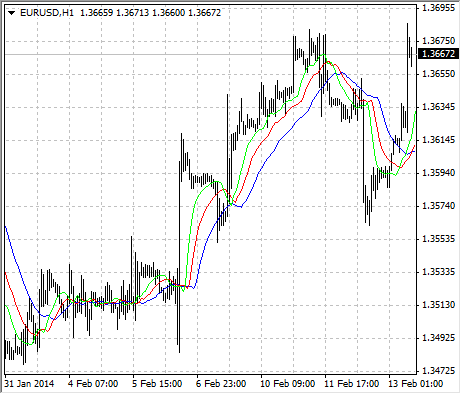
- Settings: Jaws period = 21; Jaws shift = 13; Teeth period = 13; Teeth shift = 8; Lips period = 8; Lips shift = 5
- Open Order: When the jaws, teeth, and lips (moving averages) are aligned and opening upwards.
- Close Order: When the moving averages begin to converge.
- Benefit: Identifies the start and end of market trends, improving entry and exit points.
6. Measure Market Momentum with Awesome Oscillator (AO)
Overview: Measures market momentum by comparing recent market momentum with longer-term momentum.
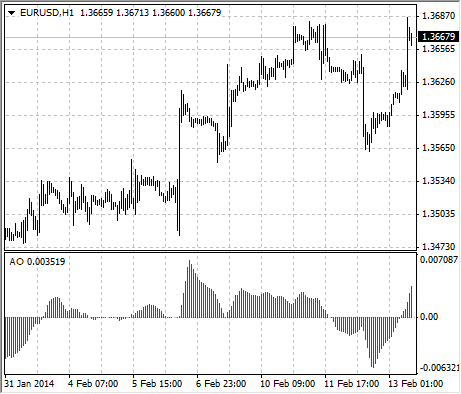
- Settings: Shift = 1
- Open Order: When the AO is greater than 0.
- Close Order: When the AO is smaller than 0.
- Benefit: Captures shifts in market momentum, signaling potential trend changes.
7. Manage Volatility with Average True Range (ATR)
Overview: ATR measures market volatility by analyzing the range of price movements.
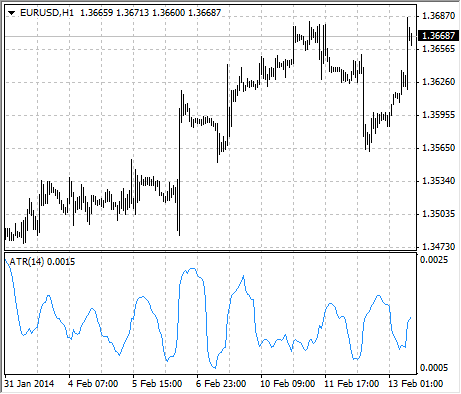
- Benefit: Typically used as a trailing stop loss or take profit level to manage trading risks effectively.
8. Identify Overbought/Oversold Conditions with Bollinger Bands (Bands)
Overview: Uses a moving average and two standard deviations to create upper and lower bands.
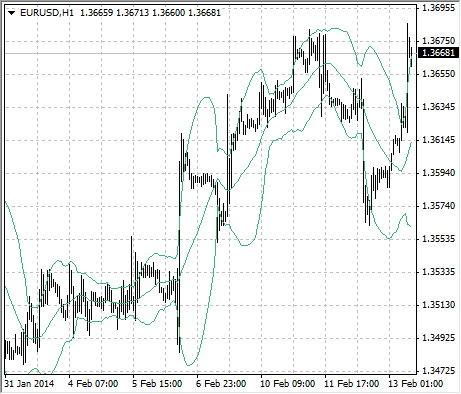
- Settings: BB period = 20, deviation = 2, band_shift = 1, price = price_close, mode = mode_upper/mode_lower, shift = 1
- Open Order: When the Ask is smaller than the mode_lower.
- Close Order: When the Ask is greater than the mode_upper.
- Benefit: Helps you capitalize on price movements back to the mean.
9. Gauge Bearish Market Strength with Bears Power (BearsPower)
Overview: Measures the strength of the bears in the market by comparing the low price to the exponential moving average (EMA).
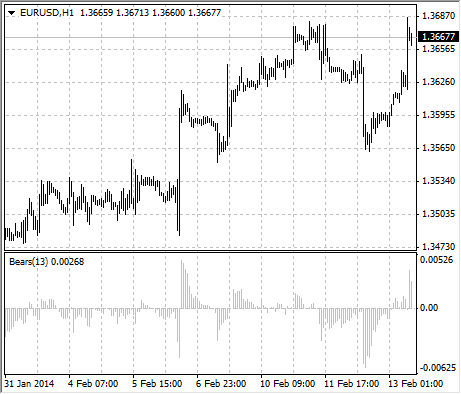
- Settings: Bears period = 13, price = price_close, shift = 1
- Open Order: When Bears Power is greater than 0, indicating decreasing bearish momentum.
- Close Order: When Bears Power is smaller than 0, indicating increasing bearish momentum.
- Benefit: Gauges bearish market strength, optimizing sell strategies.
10. Assess Bullish Market Strength with Bulls Power (BullsPower)
Overview: Measures the strength of the bulls in the market by comparing the high price to the exponential moving average (EMA).
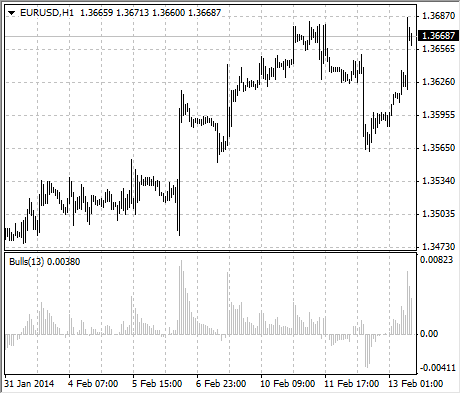
- Settings: Bulls period = 13, price = price_close, shift = 1
- Open Order: When Bulls Power is greater than 0, indicating increasing bullish momentum.
- Close Order: When Bulls Power is smaller than 0, indicating decreasing bullish momentum.
- Benefit: Gauges bullish market strength, optimizing buy strategies.
11. Facilitate Trade with Market Facilitation Index (BWMFI)
Overview: MFI shows the market's willingness to facilitate trade by measuring price movement and volume.
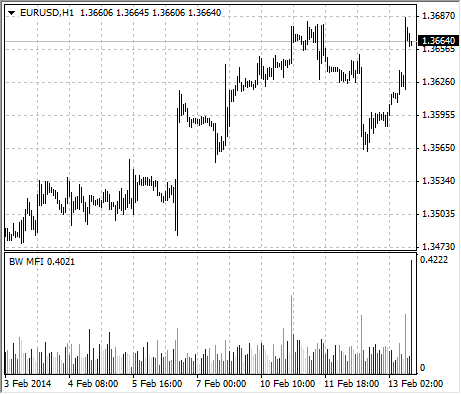
- Settings: Shift = 1
- Open Order: When MFI is below 20 (indicating oversold conditions).
- Close Order: When MFI is above 80 (indicating overbought conditions).
- Benefit: Identifies potential trend changes for mean reversion strategies.
12. Identify Cyclical Trends with Commodity Channel Index (CCI)
Overview: CCI identifies cyclical trends by comparing the current price to its moving average and standard deviation.
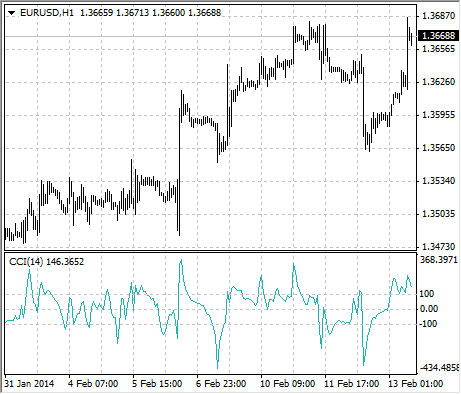
- Settings: CCI period = 20, price = price_close, shift = 1
- Open Order: When CCI is below -100, indicating an oversold condition.
- Close Order: When CCI is above 100, indicating an overbought condition.
- Benefit: Exploits price corrections for mean reversion strategies.
13. Evaluate Demand with DeMarker Indicator (DeMarker)
Overview: Evaluates the demand for an asset by comparing the current price to previous price ranges.
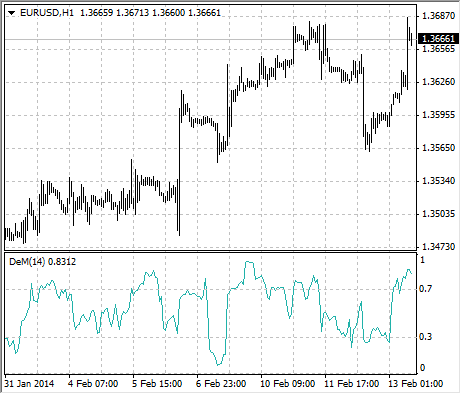
- Settings: DeMarker period = 14, price = price_close, shift = 1
- Open Order: When DeMarker is below 0.3.
- Close Order: When DeMarker is above 0.7.
- Benefit: Captures price movements back to the mean, identifying price exhaustion points.
14. Identify Overbought/Oversold Conditions with Envelopes (Envelopes)
Overview: Envelopes are plotted above and below a moving average, forming a band around the price.
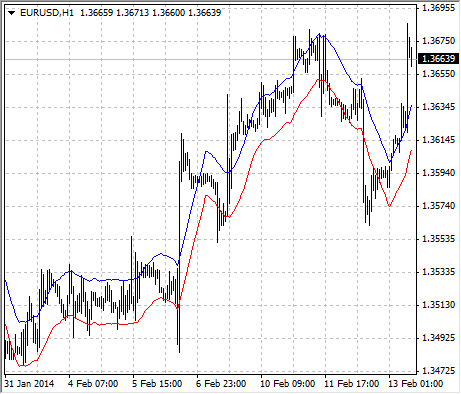
- Settings: Envelopes period = 13, price = price_close, shift = 1
- Open Order: When the Ask is smaller than the lower envelope.
- Close Order: When the Ask is larger than the upper envelope.
- Benefit: Captures price movements back to the mean, identifying extreme conditions.
15. Measure Price Movement Strength with Force Index (Force)
Overview: Combines price change, direction, and volume to measure the strength of price movements.
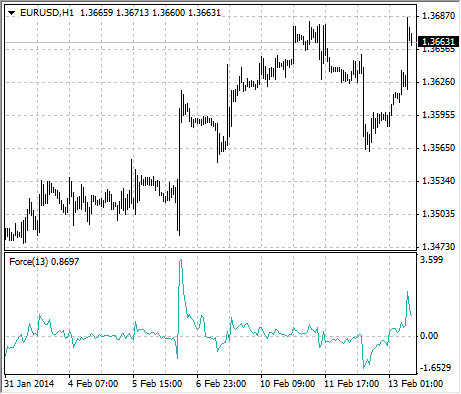
- Settings: Force period = 13, moving average type = simple, price = price_close, shift = 1
- Open Order: When the Force Index is greater than 0, indicating bullish momentum.
- Close Order: When the Force Index is smaller than 0, indicating bearish momentum.
- Benefit: Focuses on the power behind price movements, identifying potential reversals.
16. Spot Reversal Points with Fractals (Fractals)
Overview: Identifies potential reversal points by highlighting local highs and lows.
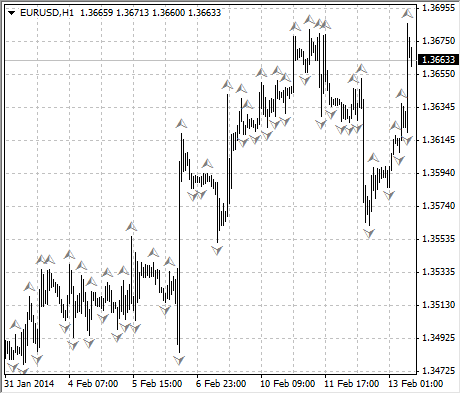
- Benefit: Used to spot trend changes and trade breakouts, though not to be used as a standalone strategy due to repainting.
17. Follow Trends with Moving Average (MA)
Overview: Smooths out price data to identify trends over a specific period.
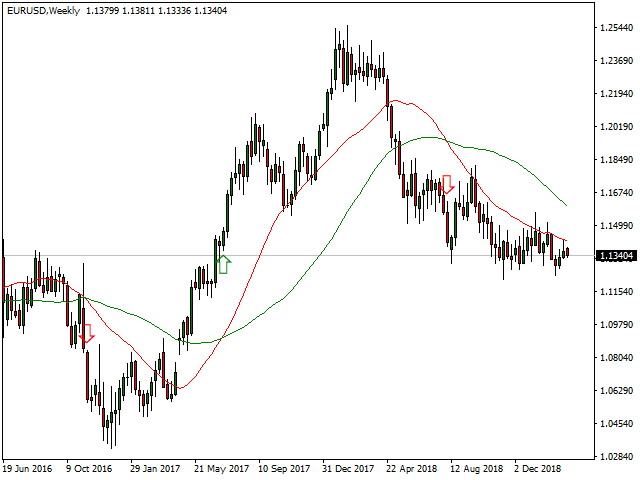
- Settings: Moving average type = simple, price = price_close, shift = 1
- Open Order: When the moving average period 50 is greater than moving average period 200.
- Close Order: When the moving average period 50 is smaller than moving average period 200.
- Benefit: Follows the moving average direction to capture market trends.
18. Identify Momentum Changes with MACD (MACD)
Overview: Combines moving averages to identify changes in momentum and trend direction.
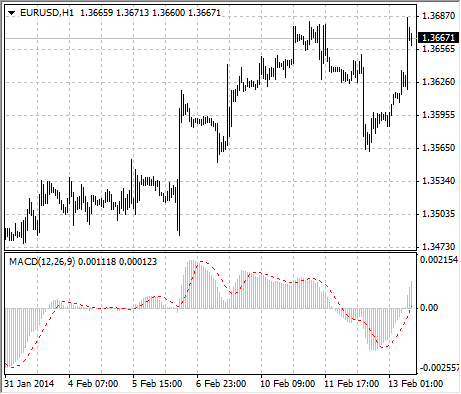
- Settings: Fast moving average period = 12, slow moving average period = 26, signal period = 9, price = price_close, mode = mode_main
- Open Order: When the MACD mode = mode_main is greater than the MACD mode = mode_signal.
- Close Order: When the MACD mode = mode_main is smaller than the MACD mode = mode_signal.
- Benefit: Provides clear buy and sell signals based on crossovers.
19. Analyze Money Flow with Money Flow Index (MFI)
Overview: Combines price and volume data to identify overbought and oversold conditions.
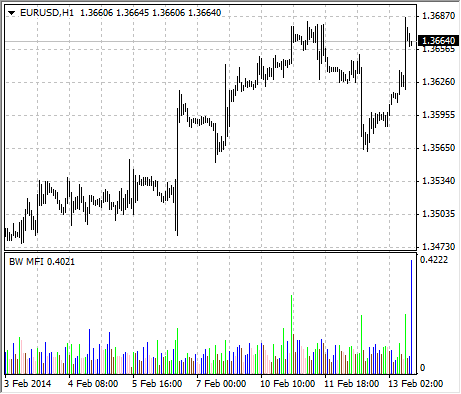
- Settings: MFI period = 14, price = price_close, shift = 1
- Open Order: When MFI is below 20, indicating an oversold condition.
- Close Order: When MFI is above 80, indicating an overbought condition.
- Benefit: Focuses on money flow trends to predict potential reversals.
20. Measure Trend Strength with Momentum Indicator (Momentum)
Overview: Measures the rate of change in price movements to identify the strength of trends and potential reversals.
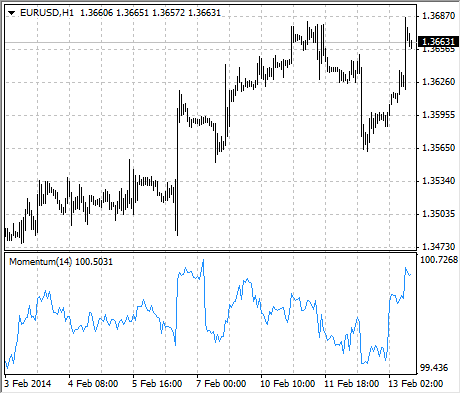
- Settings: Momentum period = 21, price = price_close, shift = 1
- Open Order: When the Momentum indicator is greater than 0.
- Close Order: When the Momentum indicator is smaller than 0.
- Benefit: Captures the speed of price changes for trend-following strategies.
21. Confirm Trends with On Balance Volume (OBV)
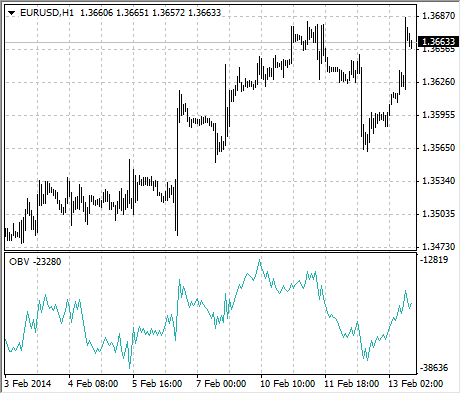
Overview: Uses volume flow to predict changes in stock
- Settings: Price = price_close, shift = 1/0
- Open order: When OBV rises, confirming an upward price movement. OBV Shift 0 greater than OBV shift 1
- Close order: When OBV falls, confirming a downward price movement. OBV Shift 0 smaller than OBV shift 1
- Type of strategy: Trend-following strategy, focusing on volume trends.
22. Seize Opportunities with Parabolic SAR (SAR)
Overview: The Parabolic SAR provides potential entry and exit points by tracking price trends with a trailing stop and reverse method.
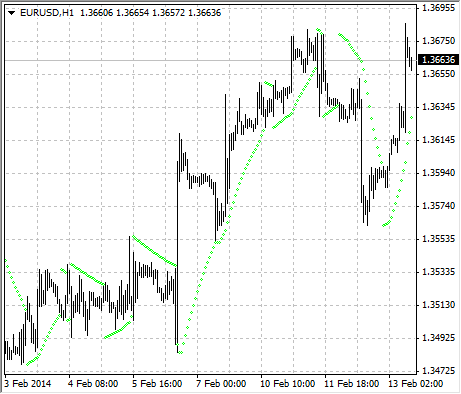
- Settings: Step= 0.02, Maximum = 0.2, shift = 1
- Open order: When the price crosses above the SAR.
- Close order: When the price crosses below the SAR.
- Type of strategy: Trend-following strategy, identifying reversal points.
23. Assess Market Risk with Standard Deviation (StdDev)
Overview: Standard Deviation measures the volatility of a security by calculating its variation from the average price. It helps assess market risk and identify potential breakouts. It helps traders set stop-loss levels.
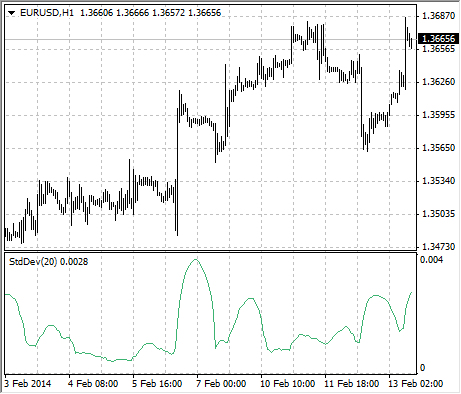
- Open order: Other strategy to open an order
- Close order: When the price hits the StdDev-based stop-loss or take-profit levels. Stoploss = Ask – StdDev, Takeprofit = Ask + StdDev
- Type of strategy: Not a strategy on its own. But typically used as a trailing stop loss or take profit level.
24. Identify Reversal Points with Stochastic Oscillator (Stochastic)
Overview: The Stochastic Oscillator compares a security's closing price to its price range over a period to identify overbought and oversold conditions.
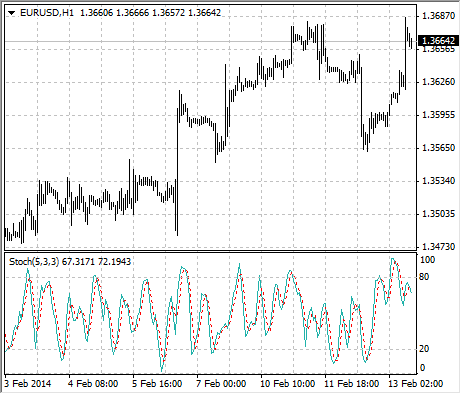
- Settings: K period = 5, D period = 3, slowing= 3, moving average type = simple, Mode = mode_main/mode_signal, shift = 1
- Open order: When the mode_main is greater than the mode_signal.
- Close order: When the mode_main is smaller than the mode_signal.
- Type of strategy: Trend-following strategy, identifying reversal points.
25. Focus on Price Extremes with Williams Percentage Range (WPR)
Overview: The Williams %R compares the closing price to the high-low range over a period to identify overbought and oversold conditions.
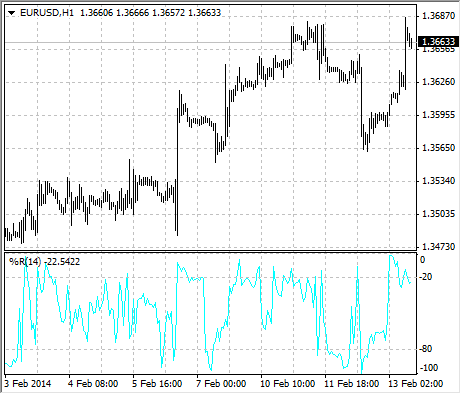
- Settings: WPR period = 14, shift = 1
- Open order: When %R is below -80, indicating an oversold condition.
- Close order: When %R is above -20, indicating an overbought condition.
- Type of strategy: Mean reversion strategy, focusing on price extremes.
Now it's your turn: Start trading
As we conclude our exploration of popular trading strategies, it's time to act!
Which strategy will you test first in your trading journey?
Share your choice in the comments below and commit to implementing it. Your proactive decision sets the foundation for your trading success. Embrace the opportunities ahead, and may your chosen strategy pave the way to profitable trades. Happy trading!
Ready to start your automated trading journey?
- Register to the Trading Bot Generator
- Purchase a subscription to the Trading Bot Generator
- Sign in
- Watch the tutorial or follow the step by step guide
- Enjoy your trading robot or unlimited Tradingview indicators/strategies!
Testimonials
4.1
out of
5
97 reviews
Great code generator!
The trading bot generator is a total game-changer! It simplifies the process of creating custom trading bots, saving me hours of coding. The wide range of indicators and customization options allows me to fine-tune my strategies easily. The web-based platform is user-friendly and accessible from anywhere. It has significantly improved my trading results. Highly recommended!
Jane
Unlimited Tradingview indicators without a tradingview subscription
I finally have a piece of my life back. I don't have to spend hours in front of a screen, but can just enjoy time with my friends. Moreover I am a frequent Tradingview user and enjoy multiple indicators without a Tradingview subscription. I've saved $45 a month
Jack
Creating a trading bot has never been easier, but documentation is sparse
The trading bot generator has made trading bots accessible to all skill levels. I can quickly assess the profitability of different strategies. If a strategy falls short, I can easily generate a new bot. The emotionless trading eliminates impulsive decisions. Comprehensive documentation could improve. Overall, a fantastic tool for boosting trading success.
Kate